You all know and love DML, those hyperlinks that show up in WinDbg output and allow you to click around aimlessly while you ponder what the crash code means (“PC LOAD LETTER??”). But, did you know that DML is even better in the Windows 10 build of WinDbg? Support has been added for a game changing feature: right click!
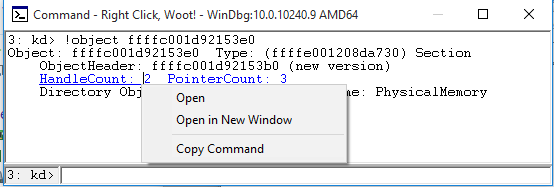
Yes, you can now right click your DML output and bring up a new menu of options:

Included in this list is the ability to open the link in a new window, while pops a command browser window with your output:

You can then dock or float this window so that you have the output handy while you continue your analysis (granted, the command browser has been there for a while, but this just makes it that much easier!).
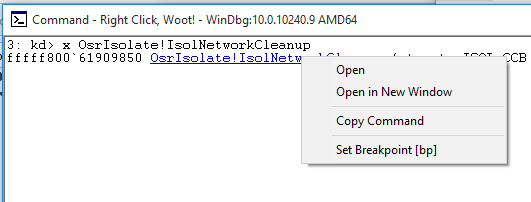
Even better, you also get command specific menu items. My favorite example of this is the x command. If you right click an entry, you get the option to set a breakpoint on the specified function.

Unfortunately this only works when you have private symbols, but how cool is that?!
I couldn’t find any docs on how to add your own right click menu items, so I did some spelunking. After right clicking an item, I performed a dump of every string in memory for the WinDbg process. In searching the output, I found what I was looking for:
<link cmd=”u fffff80061909850″><altlink name=”Set Breakpoint [bp]” cmd=”bp fffff80061909850″>OsrIsolate!IsolNetworkCleanup</link>
The altlink tag is the trick to make this work. In playing with this, you can also have multiple altlink tags for a single DML link for multiple right click options. Makes the DML string a bit wild, but the end result is very cool.
Now, go forth and right click! And be sure to let us know if you find any other commands with cool right click options.
Update: Via Twitter, Andy Lurs (@aluhrs13) pointed out that this feature is documented. Check out the Using Debugger Markup Language page on MSDN. That would have saved me some time, but it wouldn’t have been nearly as fun!
