Last reviewed and updated: 10 August 2020
As surprising as you may find this, I’m going to write a couple of blog posts about WPP Tracing.
Some Background for Context
Those of you who’ve followed us for a while know that we haven’t exactly been known as fans of WPP Tracing over the past few years. Well, as Chaucer said “As tyme hem hurt, a tyme doth hem cure” (Chaucer clearly didn’t have the opportunity to text much, but he still spelled stuff funny). And as Scott mentioned back in April of 2014, we’re giving WPP Tracing a second chance.
For the record, let me start by saying that the biggest problems with WPP tracing are historical. Over the years, compatibility among versions of tracing in kernel mode drivers has been “problematic” — and that’s putting the nicest possible spin on the topic. The tools and documentation (and the actual macros used for implementation) have also historically, ah, “sucked” would be a good term.
In recent years this has gotten better. If you’re interested in relatively recent versions of Windows, say Windows 7 and later, WPP tracing actually seems to work pretty reliably.
At OSR, we almost always use DbgPrint for developing and debugging our projects. It’s up to the dev whether we acually code “DbgPrint” (in the appropriate conditional) in-line in the driver code or embed the DbgPrint statement in a macro with fancy categories and levels. But, no matter how we do it, we always start with just good old DbgPrint. It’s fast, it’s easy, and it’s predictable. And you get to just sit in the debugger on your dev box and watch the spew arrive. Sort of like OutputDebugString would be for an app.
Of course, DbgPrint isn’t perfect. For one thing, it does no good at all for tracing issues that occur in the field. So, when we implement a project that is likely to benefit from in-field tracing to aid support, our typical approach is to covert to using WPP tracing before release. In most cases, this has been… ah… less than simple, but once the conversion is done, all has been well.
The other issue with DbgPrint vs WPP Tracing is timing. DbgPrint output is something like synchronous (it’s not really synchronous, the data goes to a circular buffer, but it definitely slows down code paths considerably with relatively high IRQL processing). I recently (like last week) was dealing with a driver for real-time control of an instrument that could repro a problem very quickly without DbgPrint enabled, but could never repro the problem with DbgPrint in use. To solve this, I converted the DbgPrint statements to WPP trace statements, ran TraceView on the target machine, and bingo! Repro in about one minute.
How did I do it? It’s surprisingly simple, once you know how. I’ll describe that for you now.
Converting DbgPrint into WPP Trace in 7 Easy Steps
In the case I just described, where DbgPrint was causing timing problems while I was attempting a repro, my goal was simply to get my DbgPrint statements… all of them… to stop being output to the debugger and instead be recorded as trace statements that I could view with TraceView. I was interested in doing this as simply and as quickly as possible. I just wanted trace output from the Debug build of the driver.
To turn my DbgPrint statements in WPP Trace statements, here’s all I had to do:
- For each source file I had I added a “#include” for a .tmh file of the same name. So, if I had a source file named “FlortzRequestManagement.cpp” up at the top of that file, with the other includes, I simply added “#include FlortzRequesetManagement.tmh” — No, I didn’t create the TMH file. The build procedure creates it. I just put the #include for it (which initially caused Intellisense to get angry, but whatever). Remember, do this for every source file that has a DbgPrint in it that’s in your driver project.

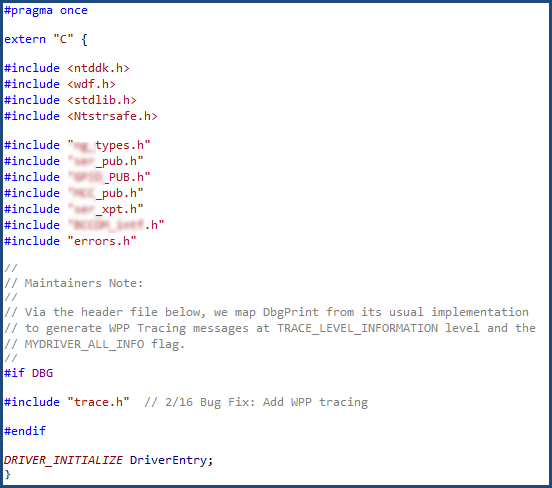
- In the “master include file” for my driver (the one that I include in every source file of my project that in turn #include’s “ntddk.h” and “wdf.h”) I add a #include for a file “trace.h” — This is the default name, but you won’t have to change anything if you just call it that. See the figure to see a copy of the top of my master .h file where I did the inclusion. Recall that I only wanted trace output from the debug build of the driver, so I conditionalized the inclusion of “trace.h” appropriately. Of course, if you don’t have a “master include file” that you use for your driver (why not?) you can always just include trace.h in each of your source files that has a DbgPrint statement in it.
- I created the aforementioned “trace.h” file and added it to my project. This file is where all the mystic monkey magic happens. I created the file by cutting, pasting, and then hacking an example from the MSDN documentation. Thank you, WDK doc people.
//
// Define the tracing flags.
//
// Tracing GUID - b99949ef-4f28-48f5-b86f-2342065ad8aa
//

#define WPP_CONTROL_GUIDS                                              \
    WPP_DEFINE_CONTROL_GUID(                                           \
        traceTraceGuid, (b99949ef,4f28,48f5,b86f,2342065ad8aa),        \
                                                                       \
        WPP_DEFINE_BIT(MYDRIVER_ALL_INFO)                              \
        WPP_DEFINE_BIT(TRACE_DRIVER)                                   \
        WPP_DEFINE_BIT(TRACE_DEVICE)                                   \
        WPP_DEFINE_BIT(TRACE_QUEUE)                                    \
        )

#define WPP_FLAG_LEVEL_LOGGER(flag, level)                             \
    WPP_LEVEL_LOGGER(flag)

#define WPP_FLAG_LEVEL_ENABLED(flag, level)                            \
    (WPP_LEVEL_ENABLED(flag) &&                                        \
     WPP_CONTROL(WPP_BIT_ ## flag).Level >= level)

#define WPP_LEVEL_FLAGS_LOGGER(lvl,flags) \
           WPP_LEVEL_LOGGER(flags)

#define WPP_LEVEL_FLAGS_ENABLED(lvl, flags) \
           (WPP_LEVEL_ENABLED(flags) && WPP_CONTROL(WPP_BIT_ ## flags).Level >= lvl)

//
// This comment block is scanned by the trace preprocessor to define the
// TraceEvents function and conversion for DbgPrint.
//
// begin_wpp config
// FUNC TraceEvents(LEVEL, FLAGS, MSG, ...);
// FUNC DbgPrint{LEVEL=TRACE_LEVEL_INFORMATION, FLAGS=MYDRIVER_ALL_INFO}(MSG, ...);
// end_wpp
//
In the code segment (which is in fact the entire contents of my “trace.h” file), you can see (a whole lot of crap but, most importantly) I map the DbgPrint statement to WPP Trace statements at level TRACE_LEVEL_INFORMATION and with the category MYDRIVER_ALL_INFO. When you run TraceView (or whatever) to request your trace output, don’t forget to enable flags for at least INFORMATION level. The TraceView default is ERROR level, so by default your trace messages won’t show up. Ask me how I know.
Be sure to generate a unique GUID for your driver’s use. Don’t just use the one that’s in the code I provided. It wouldn’t be nice if everyone used the same GUID. Don’t worry about me, the GUID shown isn’t the GUID I actually used.
You’ll also notice that the file also supports the use of the TraceEvents function, where you specify both a Level and a Flags argument. I don’t use this, but I suppose you could if you wanted to get all fancy or something.
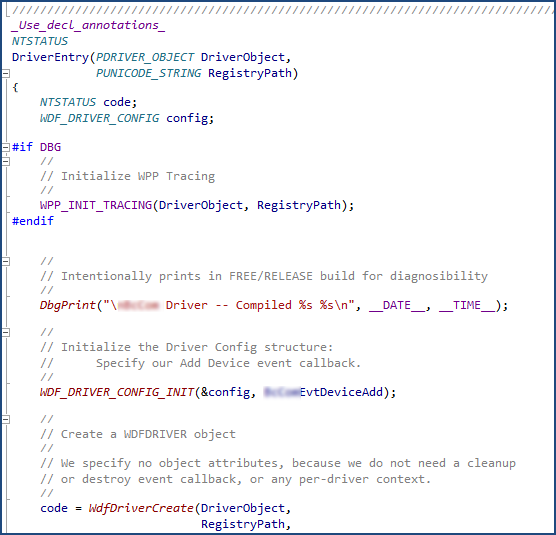
- I added a WPP_INIT_TRACING statement to my driver’s DriverEntry entry point. See the figure.

- I added a call to WPP_CLEANUP where I wanted to stop tracing, before my driver exited. The right place to put this call is in the WDFDRIVER Object’s EvtCleanupCallback function. But, I didn’t have one of these, I only create a single WDFDEVICE, and I didn’t care if I lost a few trace messages during unload of my driver. So I tossed this call in the EvtCleanupCallback for my WDFDEVICE Object.
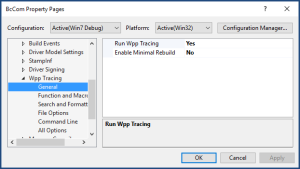
- I enabled “Run Wpp Tracing” in the Wpp Tracing, General set of Project Properties in Visual Studio. “Yes” is the default setting (that you had to turn to “No” if you didn’t originally use WPP tracing in your driver).

- Rebuilt the code debug… put it on the target machine… started TraceView… selected the PDB… set the flags to output Info level traces, started the driver… and trace messages appeared!
Seriously, that’s all I did. It’s quick. It’s dirty. But it works for me. Let me know how it works for you.
Oh… one final thing: To avoid seriously annoying the dev who takes over this project after you, if you use this approach (of changing what DbgPrint does) please put a big comment somewhere in the code (in your master include file might be a good idea) that explains that you’ve changed all the DbgPrint statements to use WPP Tracing. Otherwise, much confusion can result. Of course, once you do this… you could change all occurrences of DbgPrint to TracePrint or something and avoid the confusion altogether. But then it would be harder to return to DbgPrint output if you wanted to.
