When faced with any project related to hardware, the engineers here at OSR immediately start pushing for access to a hardware analyzer for the project. While it is generally believed that only the hardware engineers need access to this toy equipment, we’ve found having one for software development to be incredibly valuable. Trace messages and single stepping in the debugger can only show you so much. If you really want to know if you’re putting the bits in the right place you need to see things from the device’s perspective.
Depending on the technology involved, picking up a hardware analyzer “just in case you need it” is a no brainer. If you’re working with a USB 2.0 device, our recommendation for a hardware analyzer can be picked up for $800(USD) (Ellisys USB Explorer 200: http://ellisys.com/products/usbex200/buy.php). If you’re working with I2C you’re in even better luck, you can pick up an analyzer for $330 (Beagle I2C/SPI Protocol Analyzer: http://www.totalphase.com/products/beagle-i2cspi/).
Working with PCIe? No problem! Just grab a Gen3 x4 analyzer with the correct interposer for about $85,000 (LeCroy Summit T3: http://teledynelecroy.com/protocolanalyzer/protocoloverview.aspx?seriesid=357).
OK, well, maybe that’s a little hard to accept as reasonable, but you never know until you ask, right? And before you do, I suspect that you want to have some argument as to why you need this on your desk. Is it really that useful in writing a driver for a PCIe device? Also, because you know they’re going to ask, is there a cheaper alternative?
Case Study: NVMe
Of course, being the NVMe issue of The NT Insider, our target device for this article is an NVMe controller. Different devices using different technologies may have more or less support in the products discussed in this article.
Hardware Analyzers: Damn they’re cool!
It’s easy to understand the power of a hardware analyzer once you see it in action. For example, let’s discuss a pretty standard NVMe command: retrieving the NVMe controller’s Identify data structure. There are seven basic steps that must be followed in order to retrieve this data, involving both Host and Device actions:
- Host – Place an Identify Controller Command in the Admin Submission Queue (host memory)
- Host – Ring the Admin Submission Queue doorbell (device memory)
- Device – Read Identify Controller Command from Admin Submission Queue
- Device – Return Identify Controller structure into requestor’s buffer
- Device – Place command status response in Admin Completion Queue (host memory)
- Device – Write to host memory to generate the MSI-X interrupt
- Host – Ring Admin Completion Queue doorbell (device memory)
When you’re writing the driver for this, you set some structures up, write to some registers, and hope for the best. If the expected result comes back from the device, then you’re pretty sure that you got things right.
But, you don’t really know if everything is right or not, you just have faith that it is.
However, place this device on a hardware analyzer and you can see each and every one of these steps occur. Figure 1 shows steps 1-4 , starting with a ring of the doorbell by the driver to the start of the transfer of the Identify Controller structure.
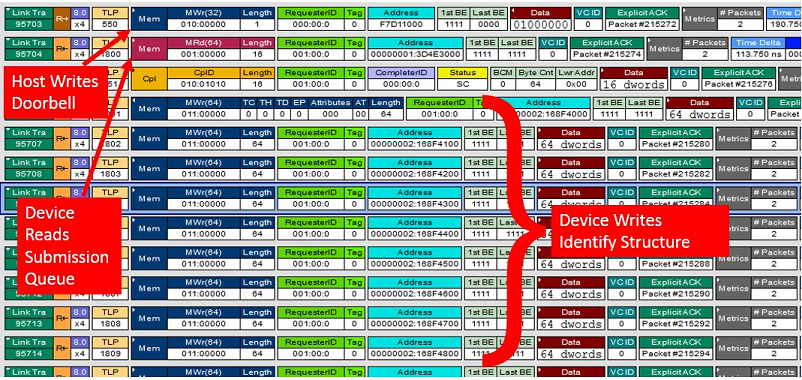
It obviously takes a considerable amount of trace spelunking and understanding in order to interpret some reads and writes in a trace as a set of higher level operations. However, you don’t always need to do this manually. In our case the LeCroy’s PETracer application has NVMe decoding capabilities and, once we turn on NVMe transaction decoding, PETracer does the work for us. Figure 2 shows the same point in the trace, but now we see this as an NVMe transaction.
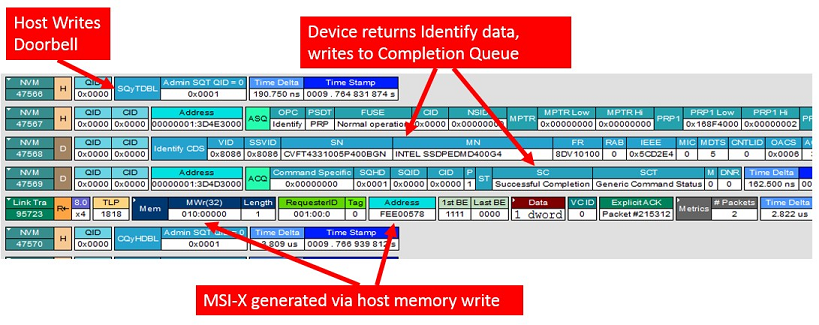
With the tracing software decoding the transactions for us, we’re also able to see the entire seven step sequence in one compact view. We’re even able to see an MSI-X interrupt being generated via a write from the device into host memory. As a software developer you just have to admit how cool it is to get this level of detail and how valuable that ability might be during development.
Software Only Analyzers: An Alternative?
Software analyzers are a whole different beast than hardware analyzers. Of course, software-based analyzers are undeniably less expensive and far less complicated than hardware analyzers. But for most software analyzers this is where their advantages end. Hardware-based analyzers show you an objective “device side” view of what’s going on. The vast majority of software analyzers offer you little more than a pretty-printed version of the data that your driver formatted and sent. Heck, most of the time I could do that with DbgPrint, if I wanted to take the time.
Nowhere is this more evident than with some of the software USB “analyzers” that are available. These decoders are often nothing more than filter drivers that intercept USB Request Blocks and provide an interpretive display of their contents. While this can sometimes be helpful, you have to wonder if there’s really enough added value to justify your time and the purchase of such a tool. This is especially true when a really great hardware analyzer for USB costs between $400 and $800, and most commercial software-based USB analyzers costs in the realm of $200.
This is not to say that there are no software analyzers that are worthy of consideration. In the hardware analyzer example using NVMe that we discussed previously, we showed how helpful a PCIe bus analyzer can be. But every shop doesn’t have $85K to spend for this type of hardware. If your work is limited to a specific area, such as Windows storage controller drivers in general on NVMe in particular, are there any software-based analyzers that can provide real assistance?
With a Windows storage controller driver, software analyzers can actually play quite an interesting role. At their device edge, controller drivers communicate with their hardware using a protocol defined by the hardware. With NVMe, the controller driver sends NVMe commands over PCIe. Clearly a PCIe analyzer with NVMe decoding capabilities is the best choice for analyzing this portion of the driver.
However, at their host edge, controller drivers in Windows communicate using SCSI and SCSI Request Blocks. It is the job of the controller driver to translate between their native device edge and the host SCSI interface. A software analyzer in the host can be used to trace the SCSI edge of the driver interface, which can be used to analyze and validate the translations being performed by the driver.
Of course, the utility of the software analyzer hinges much upon the quality of the software. While working on our NVMe controller driver, we’ve found the busTRACE 10.0 from busTRACE Technologies (http://bustrace.com) does an excellent job of providing insight into the host side of our translations. Not only does it actually show us a trace of the operations being performed, but it adds a significant level of validation to each of the responses returned by the driver.
A good, real example of this from our development experience comes from running the WHCK SCSI Compliance Test 2.0 as part of certifying our solution. Our driver passed all of the SCSI Inquiry related tests with no errors or warnings, but received a validation failure in the associated busTRACE capture. In Figure 3, you can see that busTRACE does not believe that the IEEE Company ID returned in the Device Identification Page to be correct.
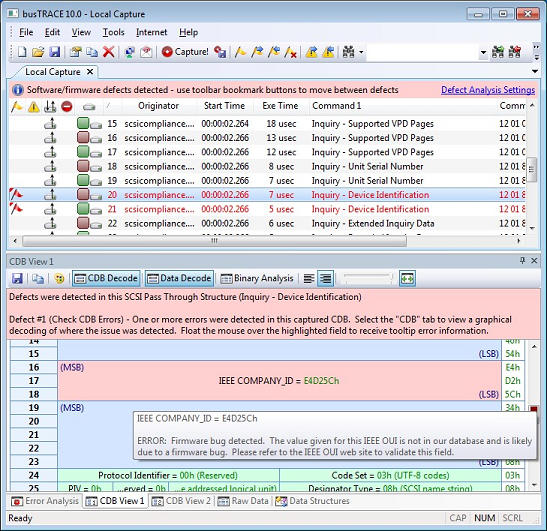
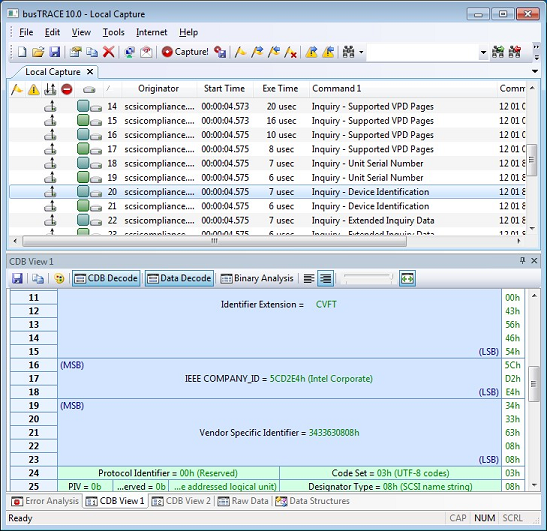
This was surprising, as we simply take the data from the NVMe Identify structure and place it into the corresponding SCSI Inquiry structure. Looking at the data returned from the device and the failing data from busTRACE, we realized the error: SCSI devices returned this data in the reverse order and thus the host is expecting the bytes to be reversed. A quick code change and we passed both the WHCK SCSI Compliance Test and the additional busTRACE validations (Figure 4).
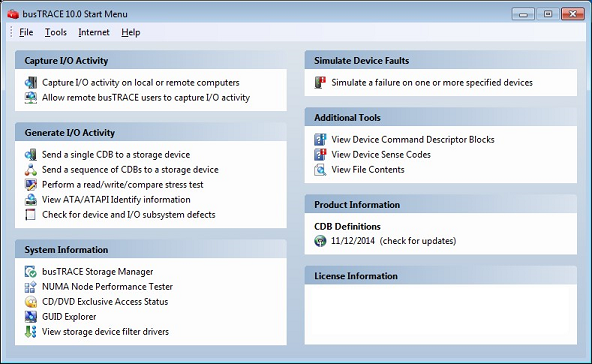
Aside from just the translation help, busTRACE also does a nice job of enforcing some other best practices, such as ensuring that the host is informed that no data was transferred when an error occurs. It also provides insight into all the other, non-SCSI based things going on in the host, such as PnP and Device Controls IRPs. busTRACE also does a nice job of value adding with features above and beyond just logging, such as providing I/O stress and data validation utilities. Some of the additional features can be seen in the busTRACE Start Menu, as seen in Figure 5.
Hardware, Software, or Both?
As you can probably tell, we’re pretty high on all the analyzers that we’ve discussed, both hardware and software. This is definitely not where our opinion on the matter started, we had always stood firm on the fact that hardware analyzers were the only ones worth having. However, after seeing some of what busTRACE had to offer we have definitely seen the light a bit. Now we wouldn’t start any project without having both a hardware and software analyzer at the ready for whatever problems might come.
