Last reviewed and updated: 10 August 2020
In 2012 a group of researchers published a paper titled, Awe Expands People’s Perception of Time, Alters Decision Making, and Enhances Well-Being. The conclusion of the paper is that experiencing the feeling of awe might just make us happier, change our perception of time, and even make us more likely to volunteer (thus making the world a better place). This clearly indicates that we need more awe in our lives, we owe it to ourselves and to society as a whole.

Given this research, we figured it was time for another article about Xperf. No, not the French produced guinea pig food (which, according to the Amazon reviews, is awe inspiring in its own right, see Figure 1), but the utility provided by Microsoft for performance analysis on Windows. We’re always shocked to see how few people take advantage of what is one of the most awe inspiring tools you can get for free these days.
We discussed the basics of collecting traces back in 2010 with the article Get Low – Collecting Detailed Performance Data with Xperf. If you’ve never read that article please do that now as it should give you a good feel as to what Xperf is all about. Note however that article references an old GUI that has since been replaced by the Windows Performance Analyzer utility, which we’ll be using in this article.
For this article, we’re going to take a different approach than we did previously. We’re going to create an incredibly trivial and overly simplistic example that demonstrates timer skew and see how we might use Xperf to analyze the cause of that skew. In addition, we’ll show you how to inject your own, custom trace points into an Xperf analysis to help identify specific behavior in your driver.
The Example: A Timer That Fires Every 15ms…Or Not…
Did we mention that the example would be incredibly trivial and overly simplistic? Don’t worry, the implementation will be even more trivial and simplistic. Our goal is to use Xperf to methodically extract information from a Windows machine exhibiting a particular behavior, not design a real solution to a real problem. Please keep eye rolls to a minimum and focus on the analysis!
Let’s say we have a simple KMDF driver that requires a periodic timer that fires every 15ms, which we know to be about the granularity of the interval timer on Windows. We’ve heard that Windows is not a real time OS, but we choose to believe that things will be “close enough” and plow ahead with our implementation anyway. We’re also good with the timer firing within 5ms either way of our deadline, so as long as it doesn’t take more than 20ms between timer fires, we won’t severely injure someone (much).
KMDF makes the creation of our timer callback simple, we just initialize the appropriate configuration structure and create the timer with WdfTimerCreate:
    WDF_TIMER_CONFIG_INIT_PERIODIC(&timerConfig,
                                   NothingEvtTimerFunc,
                                   15);

    WDF_OBJECT_ATTRIBUTES_INIT(&objAttributes);

    objAttributes.ParentObject = device;

    status = WdfTimerCreate(&timerConfig,
                            &objAttributes,
                            &devContext->Timer);
Prior to starting the timer, we capture the current system time with KeQuerySystemTime so that we can check the elapsed time in the timer callback. We then start the timer with WdfTimerStart:
    KeQuerySystemTime(&devContext->LastTimestamp);

    (VOID)WdfTimerStart(devContext->Timer,
                        WDF_REL_TIMEOUT_IN_MS(15));
In the timer callback, we calculate the delta between the current time and the previously recorded time and check to see if it exceeded 20ms (in 100ns units). If it does, we record a “miss”. Otherwise, we record a “hit”:
VOID
NothingEvtTimerFunc(
_In_ WDFTIMER Timer
) {
LARGE_INTEGER currentTime;
LONGLONG delta;
PNOTHING_DEVICE_CONTEXT devContext;
devContext = NothingGetContextFromDevice(WdfTimerGetParentObject(Timer));
KeQuerySystemTime(¤tTime);
delta = (currentTime.QuadPart - devContext->LastTimestamp.QuadPart);
if (delta > ((20 * 1000 * 1000) / 100)) {
devContext->Misses++;
} else {
devContext->Hits++;
}
devContext->LastTimestamp.QuadPart = currentTime.QuadPart;
return;
}
We then start the driver, let it run for a while, and dump out our context structure in the debugger. Much to our surprise, on a seemingly idle system we’ve had a good number of misses:
0: kd> dt 0xffffe001e984c600 Nothing_KMDF!NOTHING_DEVICE_CONTEXT
+0x000 Nothing : 0
+0x008 Timer : 0x00001ffe`166eda48 WDFTIMER__
+0x010 LastTimestamp : _LARGE_INTEGER 0x01d0511c`90e0118a
+0x018 Hits : 0x13a8
+0x01c Misses : 0x43
0x43 injured people in a few seconds seems like a bad situation for a product, so we want to investigate more. What happened during those 0x43 occurrences that led to the missed timer period??
Enter Xperf and the Windows Performance Analyzer
This scenario is exactly what Xperf is all about. Xperf gives us the ability to peer into the state of the Windows OS and see exactly what was happening over a collection period. Xperf is provided as part of the Windows Performance Toolkit, which installs along with the WDK.
Xperf itself is simply a utility to enable and collect data from Event Tracing for Windows (ETW) Providers. There is one provider, the NT Kernel Logger, which provides kernel level trace data from the OS and any Microsoft supplied drivers (e.g. WDF, Filter Manager, etc.). Additionally, there are any number of “User Mode Providers”, which despite the name, can exist either in user mode or third party kernel mode. User Mode Providers are identified and enabled either by GUID or by a registered name.
To start our analysis, we’re going to focus on enabling the NT Kernel Logger. There are various flags that we can enabled for this provider and we can see them by running: xperf.exe –providers kf. For this trace, we’re going to choose to enable the following flags in the NT Kernel Logger:
- PROC_THREAD – Records process and thread activity
- LOADER – Records the loaded module list from the system, which will allow us to resolve function addresses into function names using PDBs
- DPC – Deferred Procedure Call activity. WDFTIMERs are really just DPCs under the hood, so this is an important one
- INTERRUPT – Interrupt Service Routine activity. Interrupts can interrupt DPCs, so interrupts might be the reason for our misses
- WDF_DPC – We’re using a KMDF driver for this activity, so this is an important flag to set. Using this flag, the NT Kernel Logger will work in conjunction with WDF to record our DPC routine information instead of the Framework’s. Without this flag, all DPCs used by all KMDF drivers would be bundled together in the trace (i.e. every DPC event logged from a KMDF based driver would point to the one Framework DPC wrapper)
- WDF_INTERRUPT – Same as WDF_DPC, except for Interrupt Service Routines. We don’t have an ISR in this driver, so this one is just for completeness
We enable all of the above with the command shown in Figure 2:

We can now enable our driver, allow a few seconds to pass to collect some data, and then stop the trace. The resulting log data will be collected to an Event Trace Log (ETL) file that we specify. In this case, we’ll store the results into the TickMiss.etl file (again, see Figure 2).
Now for the fun part. By double clicking the resulting ETL file, we will open the trace data in the Windows Performance Analyzer (WPA) application (Figure 3).
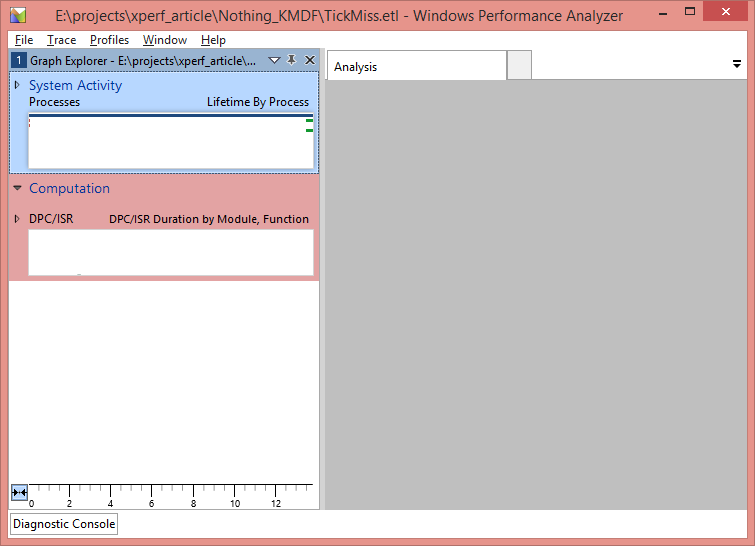
On the left hand side of WPA, we see entries for each of the ETW Providers and flags that we enabled. Before proceeding any further, we want to translate any function addresses in the trace into symbolic names. We’ll do this by clicking Trace->Load Symbols.
Once the symbol files have loaded, we want to dig in to some details about what was happening on the system. The view of the data that we’re going to focus on for this article is the DPC/ISR Timeline by Module, Function, which you can find under the
Computation entry in the Graph Explorer. Once you have located this view, double click on it to bring it into the Analysis window. The resulting display will look something like Figure 4.
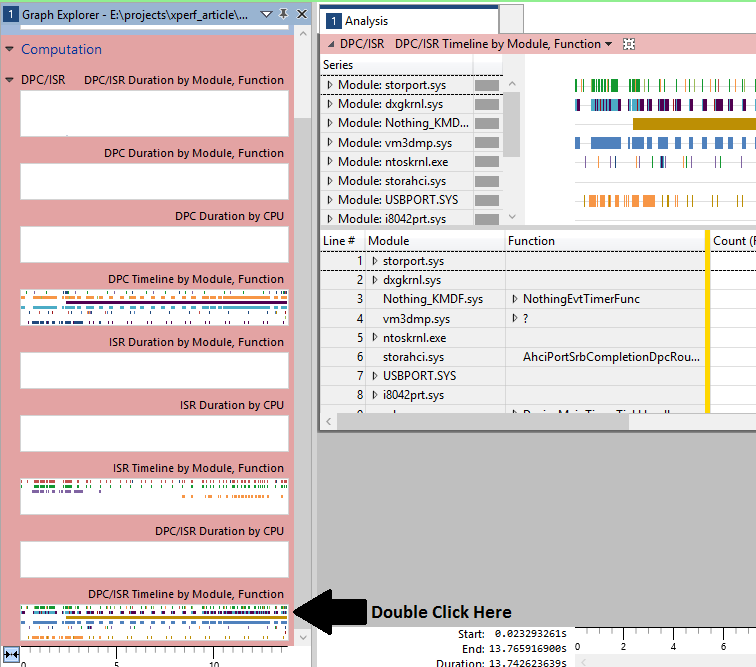
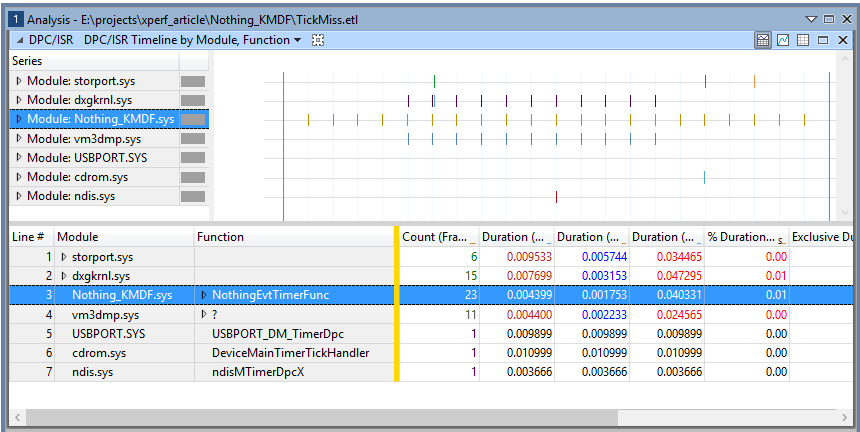
What we see in the resulting Analysis window is a timeline showing the duration of every DPC and every ISR that happened during the trace. The DPCs and ISRs are grouped by the module that they occurred in and we do indeed see invocations to our NothingEvtTimerFunc happening in the Nothing_KMDF.sys module. By clicking on this entry in the display, WPA will highlight each execution of the callback in the timeline, as shown in Figure 5.
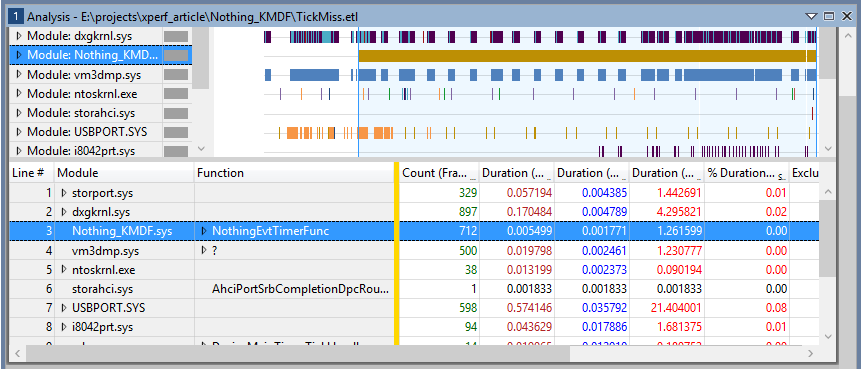
If we right click at this point and select Zoom, the display will zoom in and only show the period of the timeline where there are events from our driver. This allows us to immediately exclude anything in the trace that happened before our driver was loaded, which is a useful first pass at isolating what interests us.
Additionally, we can use the mouse to highlight a custom range and then zoom into that, which you can see in the following two steps. First we highlight, as shown in Figure 6.
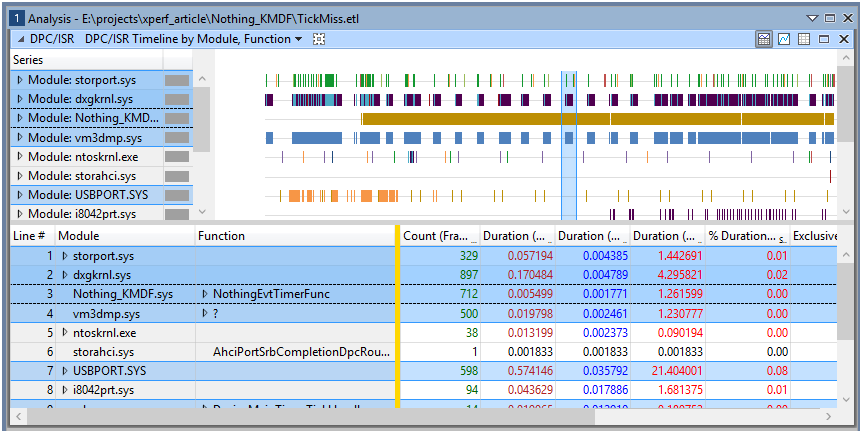
And then we zoom by Right Clicking and selecting Zoom. The result of the zoom is shown in Figure 7.
Pretty awesome, right? We get to see exactly which DPCs and ISRs were running during this time period and potentially use that to locate where our delays are coming from.
Needle in a Haystack?
Of course, the astute reader is probably thinking “Great. I am now full of awe and am heading off to do volunteer snow shoveling of roofs in New England. However, when I get back I have no idea which of these events corresponds to a missed timing.”
The trouble of course is that this trace is giving us everything, not just the moments of time where we get a miss of our timing window. According to Figure 5, there were 712 unique invocations of our timer callback in this trace (the Count column). Some small percentage of these indicate misses, so how are we supposed to isolate the “bad” invocations without going through all 712?
This is where adding our own, custom trace points to the Xperf analysis comes in. This involves turning our driver into an ETW Provider and generating trace events at the appropriate time. Once our driver has trace events, we simply need to enable our ETW Provider along with the NT Kernel Logger. This way, we’ll have both sets of trace events in the resulting ETL and can use our custom trace events to focus our analysis.
Creating an ETW Provider
Turning our driver into an ETW Provider is a simple process, even if the syntax might be a bit confusing. Here are the steps we need to follow:
- Create an “instrumentation manifest” that describes our trace events. This is just an XML file that we can either create by hand or by using the SDK’s Manifest Generator utility (EcManGen.exe)
- Modify our project to invoke the Message Compiler to turn our manifest into:
- A binary resource blob to include in our image
- A header file with generated functions to register our ETW Provider, unregister our ETW Provider, and generate trace events
- Include the header file generated in Step 2
- Add trace events to our code
The manifest file is pretty ugly, but there is much documentation and many samples for both user mode and kernel mode available. The rest of the steps are the same in user mode and kernel mode and are relatively straightforward.
In our example, the important part of our instrumentation manifest is the portion that describes our one event that we log (full manifest is provided with the sample code). This event will be logged any time we experience a miss in our timing window and will include with it the time delta:
        <templates>
          <template tid="tid_Expiration">
            <data
                inType="win:UInt64"
                name="Delta"
                outType="win:HexInt64"
                />
          </template>
        </templates>
        <events>
          <event
              channel="SYSTEM"
              level="win:Informational"
              message="$(string.ExpirationMiss.EventMessage)"
              opcode="win:Info"
              symbol="ExpirationMiss"
              template="tid_Expiration"
              value="1"
              />
        </events>
The template describes what data we’ll be logging with our trace event. In this case, we’re going to input a single 64-bit value named “Delta” and we want that output in Xperf as a 64-bit hex value.
The event describes the actual event, which refers to the template to supply input and output data.
Once we have compiled this manifest and included the appropriate header in our project, we can call a generated function named EventWriteExpirationMiss (this is “EventWrite” followed by the symbol tag from the above manifest). We’ll provide to this function an optional activity ID (for matching up related trace events) and the delta from our calculation:
if (delta > ((20 * 1000 * 1000) / 100)) {

    devContext->Misses++;

    EventWriteExpirationMiss(NULL, delta);

} else {

    devContext->Hits++;

}
Registering Our Provider
On our test system, we’ll want to register our manifest as an ETW Provider. This makes starting and stopping traces easier, as we can do it by name instead of GUID, and allows Xperf to put some additional information in the ETL file. Open an elevated command prompt and import the manifest using the wevtutil.exe utility as shown in Figure 8.

Starting a New Trace
We now need a new Xperf trace that includes our custom trace data. We’ll do that by enabling both the NT Kernel Logger as well as our custom provider on the xperf.exe command line. This is as easy as adding another –start directive, followed by a custom name for this trace, followed by the registered name in the manifest (in this case “OSR Nothing KMDF”). The full command line is shown in Figure 9.
After a period of time, we’ll then want to stop both ETW Providers. Again, we simply need to specify two –stop directives on the command line (again, Figure 9). Trace data from both providers will appear in the resulting ETL file.

Finding Our Custom Trace Events
It’s not intuitively obvious where our trace events can be found in the WPA, but once you know where they are it sort of makes sense. Because we’re a third party driver generating trace data, we are considered to be a “User Mode Provider” (yes, even though we traced this data in kernel mode). User Mode Providers are found in WPA under System Activity->Generic Events. The events here are listed in a timeline and grouped by the ETW Provider. Thus, double clicking on this entry in the Graph Explorer shows us our custom trace events in the Analysis view (Figure 10) along with any other User Mode Providers that were enabled.
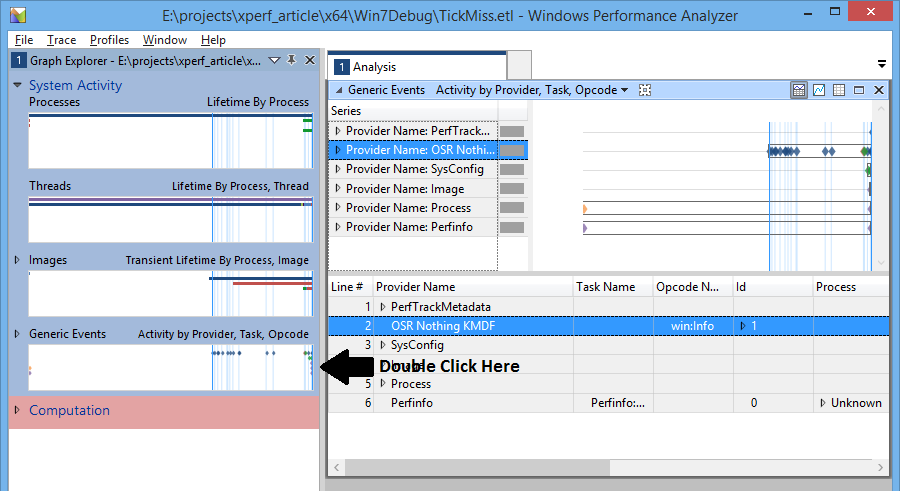
Using this, we now know which parts of the timeline include misses of our deadline. We can use the zoom in feature of WPA to zoom in to a particular time period, then explore the other ETW Provider data within that period to determine the cause.
As an example, Figure 11 zooms in to the period in between two invocations of the timer callback. Each of those invocations is shown by a blue line on the timeline. The first invocation hit the deadline, but the next invocation did not (as evidenced by the existence of our custom trace event, shown as a diamond on the “Provider Name: OSR Nothing_KMDF” series in the top right)). By zooming all the way in to this time period, we can see that in between these two invocations there was a DPC or ISR from the graphics subsystem (dxgkrnl), VMware (vm3dmp.sys), and the OS itself (ntoskrnl). In addition, the storage controller (storport) generated 10 DPCs or ISRs in this window. Even though you can’t see each of these on the DPC/ISR Timeline in Figure 11 (they are there, you just would have to zoom in a bit further to see 1 instance of an event), you can see these events listed in the table at the bottom.
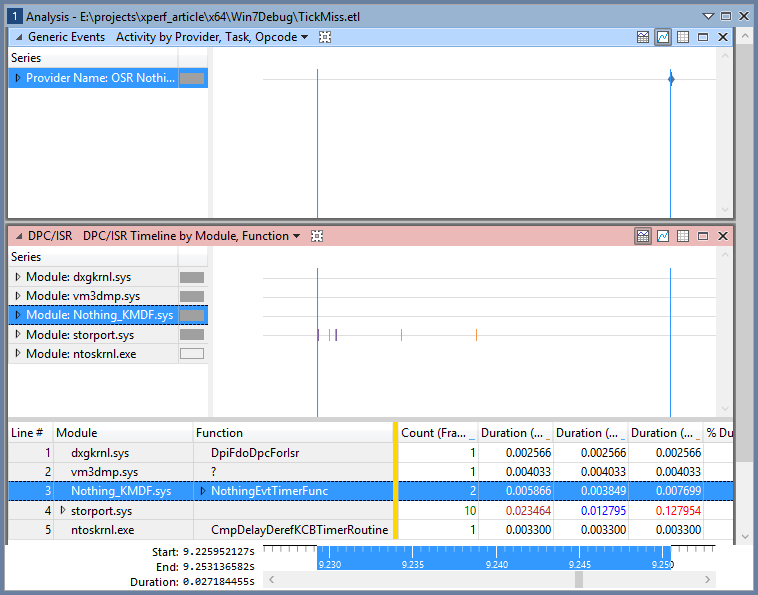
What we have here, then, is clear evidence that there was nothing wrong with the system, it was just busy, and that Windows is not suited to this sort of task. However, using Xperf we don’t need to “guess” that this is true, we can actually collect the data and see for ourselves.
Try It Yourself!
That’s a lot of screen grabs and bits of information and we barely scratched the surface, but hopefully you’re awestruck enough to want to try it yourself. When it comes to Xperf practice is truly the best way to learn, as it takes exposure and perseverance to be able to interpret any of this data. That’s why we’re providing the source to our example along with this article. Install it, run the experiments, and start being a happier person today!
Code associated with this article:
http://insider.osr.com/2015/code/xperf.zip

