Last reviewed and updated: 10 August 2020
If you’re a developer who’s been using WDF for a while, you’re probably comfortable writing a KMDF or UMDF driver. And, if you’re comfortable writing a driver, you’re probably reasonably comfortable setting up and using the debugger to help you get that driver working.
But if you’re like most of us, you could still benefit from a few tips on developing and debugging. If so, here are five hints that every WDF driver dev can use to make their life easier.
Hint 1: Set Your Symbol Search Path Properly – This is Always Step 1
If you’ve been working with WDF for a while, you probably already know this. But it’s worth repeating: There’s not much you can do, except get frustrated, if you attempt to debug your WDF driver without using the proper symbols. This includes not only symbols for your driver, but symbols for the Windows OS and HAL, and symbols for WDF as well. Neither WinDbg itself nor the WDF Kernel Debugger Extensions will work correctly until you have all the correct symbols loaded. Therefore, loading the right set of symbols is not an optional step. If you’re going to use the debugger, you really must do it.
Fortunately, getting your symbols set up is easy. If the system on which you’re running the debugger can access the internet, you can issue the command “.SYMFIX” followed by “.RELOAD” to the WinDbg command prompt. “.SYMFIX” sets your symbol search path to the Microsoft Symbol Server, and “.RELOAD” causes the symbols to be loaded. You can find a more detailed description (including an optional video, even) of how to properly setup your WinDbg symbols here in the OSR Developer Blog. If your debug environment is not able to access the internet (poor you!), check out the article in this issue of The NT Insider about how to setup your symbols.
Hint 2: Enable Windows Driver Verifier and WDF Verifier When Testing – Always
While you’re working on your UMDF v2 or KMDF based WDF driver, always enable WDF Verifier on your test system. If you’re writing a KMDF driver (or a WDM driver for that matter), also always enable Windows Driver Verifier. These tools will help you catch errors in your code much earlier than you would otherwise. They are not noisy, they do not generate spurious errors, and they are both tools that are entirely appropriate to use while your driver is actively under development and “not yet finished.”
You can control Windows Driver Verifier using the tool Verifier.exe that is installed as a standard part of any Windows installation. As part of enabling Windows Driver Verifier for your driver, select both your driver and WDF01000.SYS (the Framework itself) to be verified. Enable all the options in Windows Driver Verifier, except IRP Logging and anything with “low resources simulation” in the name. If you don’t interact directly with PoFx, you should probably leave “Power Framework Delay Fuzzing” off as well. After enabling Windows Driver Verifier on your test system, you’ll have to reboot for your new Windows Driver Verifier settings to take effect.
When you enable Windows Driver Verifier for a WDF driver, WDF Verifier is also automatically enabled with basic settings. You’ll probably want to enable more checks in WDF Verifier than Windows Driver Verifier enables automatically.
You enable WDF Verifier and specify the specific options you want to use for your driver via settings under your driver’s key in the Registry. For KMDF, specify your WDF Verifier settings under the following path:
HLKM\System\CurrentControlSet\Services\<drivername>\Parameters\Wdf
For UMDF, the path is:
HLKM\SOFTWARE\Microsoft\Windows NT\CurrentVersion\WUDF\Services\<drivername>\Parameters\Wdf
The values that we recommend for you to set are the following (all REG_DWORDs):
- VerifierOn: Set to a non-zero value, enabled WDF Verifier
- Verbose: Set to a non-zero value, causes additional logging to the WDF Log
- VerifyDownLevel: Set to a non-zero value to enable the most WDF Verifier checks, not just those that were current for the version of WDF against which your driver was built.
- EnhancedVerifierOptions: For KMDF only… Set to 1, ensures your driver’s Event Processing Callbacks return at the same IRQL at which they are called.
There are other useful values that you can set as well, but the items listed above are a good start. Check the MSDN documentation for “Registry Values for Debugging WDF Drivers” for the full list.
Note that WDF Verifier works with both UMDF V2 drivers as well as KMDF drivers. Remember to make these Registry entries on the test system, where your driver under test is running, not on the system you’re debugging from! You’ll need to restart the test system for the settings to take effect.
If you don’t feel like playing with the Registry directly, the WdfVerifier utility (WdfVerifier.exe) ships in the \tools subdirectory of the 8.1 and later WDK. There’s not much that’s magic about this utility. It basically just makes the Registry changes for you, and therefore keeps you from having to remember the exact names of all the Registry values.
Regardless of how you do it, the important part of this hint is to always enable both Windows Driver Verifier (for KMDF drivers) and WDF Verifier (for KMDF or UMDF V2 drivers) on your test machine. Here at OSR, we often create our INF files to enable WDF Verifier in the Registry by default. If you do this, be sure to remember to delete those values before shipping your INF!
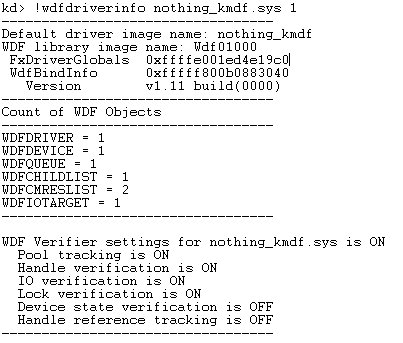
One more tip: To check what WDF Verifier settings are enabled for your driver, use the !WDFDRIVERINFO WinDbg command with a flag value of 1, as shown in Figure 1.

Hint 3: Whenever You Encounter a Driver Problem, Examine the WDF Log
Got an error status back from your call to WdfIoQueueCreate? Perhaps your driver was running great, and then it suddenly crashed. In debugging a WDF driver problem, your first step should always be to examine the WDF Log.
The WDF Log is always enabled. You examine the log using the command:
!WDFLOGDUMP <drivername.sys>
Because you’ve enabled both WDF Verifier and Verbose Logging (as a result of reading and following Hint 1), your log can contain all sorts of additional interesting information whenever you encounter a problem. Sure, there can be a lot of nonsense about internal plug and play and power states. But, trust me, you’ll get used to seeing that after a while, and you might even find it helpful someday. Until you do, just look for log entry information that’s really obviously useful. When you have Verbose Logging enabled, I bet you’ll be surprised at the very “English-Language like” information that can appear in this log to help you diagnose a problem.
Figure 2 shows an example of output from the WDF Log displayed after an error was encountered in the driver’s EvtDriverDeviceAdd Event Processing Callback. The dev creating this example cut and pasted some code to create a WDFQUEUE, but changed the Queue Dispatch Type to Manual. You can see the results at log records 12 through 14.

Zoom in on the figure if you’re having trouble reading it. In any case, the relevant message read, in part, “FxIoQueue: Initialize – Cannot set io callback events on a manual WDFQUEUE…” and “FxIoQueue: _Create – Could not configure queue…”
Not every message is this clear, but (when verbose logging is enabled) many are. This is why it makes sense to check the log every time you find an error.
Hint 4: Those Weird NTSTATUS Values are WDF-Specific Statuses
A very common question that we get in our WDF seminar is, “What’s going on! The NTSTATUS value I got back from calling a WDF function isn’t listed in NTSTATUS.H!” Correct! If you get a status value that starts with 0xC020xxxx, it’s a custom WDF status value. Check the file WDFSTATUS.H in the WDK’s \Include\wdf\kmdf\<version> or \include\wdf\umdf\<version> directory. There you’ll find the definitions of the WDF-specific status values, some of which are very specific and helpful. Awesome, right?!
Hint 4: Don’t Worry if the WDF Log Contains Odd Function Names
This is a problem that we don’t see as much with new versions of KMDF than we used to. But if you’re using an older version of WDF you may still run into it, so it’s worth mentioning.
Let’s say, for example, you call WdfWorkItemCreate and forget that specifying a WDF_OBJECT_ATTRIBUTES structure is required. You get back an error, but when you look in the WDF Log for further information you see a message that says something like:
imp_WdfDpcCreate – WDF_OBJECT_ATTRIBUTES required, status 0xc0200212
We previously explained how to make sense out of the status, but what’s with the “WdfDpcCreate“?? Your driver might not even call WdfDpcCreate.
In older versions of KMDF, the function name shown in the Log isn’t always correct – So, you should just ignore it. We whined to the WDF team about it, and they’ve fixed most of these references in newer version of KMDF. In a recent version, for example, instead of the above message you’ll get:
FxValidateObjectAttributesForParentHandle – WDF_OBJECT_ATTRIBUTES required, NTSTATUS=C0200212
That’s much better, don’t you think? Thanks WDF team! Meanwhile, if you’re using an older version of KMDF, don’t be confused if you see the name of a function you didn’t call. Just ignore the name, and pay attention to the message.
Hint 5: Use the WDF Debugger Extensions!
Our final hint is really the gateway to WDF debugging power. I used to sit across the hall from a guy who worked pretty frequently on WDF drivers. I’d hear him in his office cursing, trying to figure out what was going wrong in his KMDF code. I think he felt like he never really knew what was happening, between the Event Processing Callbacks, the WDF-managed state, and the opaque WDF Objects. He could debug a WDM driver in a flash – but trying to run down problems in a KMDF driver often left him frustrated.
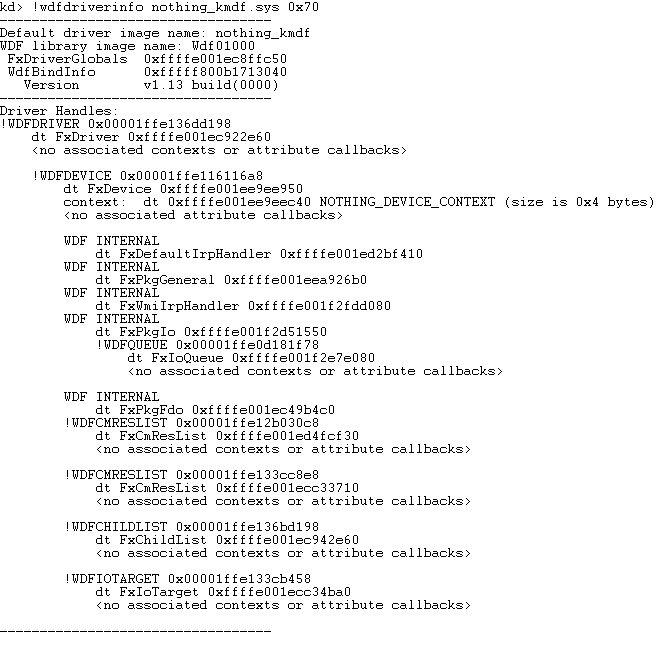
The hint he was missing was that he needed to make better use of the WDF Kernel Debugger Extensions. These extensions are the key to WDF driver debugging happiness. When I’m debugging a WDF driver, I usually like to start by viewing the driver’s WDF Object hierarchy, and the handles associated with each of the objects. This is easily done by using the !WDFDRIVERINFO command with a flags value of 0x70 as shown in Figure 3.

In Figure 3, you can see we have a WDFDRIVER Object (with no context) that has a single WDFDEVICE associated with it. That context is of type NOTHING_DEVICE_CONTEXT, and if we want to see what’s in the device context area, we can dump it using the DT command shown.
It’s a bit hidden (look carefully in Figure 3 to find it, buried after the 4th WDF INTERNAL object in the handle list), but you can also see that there’s a single WDFQUEUE associated with the WDFDEVICE. You can just cut and paste the WDFQUEUE command shown in the output to find information about the Queue. This is shown in Figure 4.

In the output shown in Figure 4, you can see the Queue’s attributes. Note that a PASSIVE_LEVEL Execution Level constraint has not been applied (“ExecutionLevelDispatch” is shown) and there’s no Sync Scope associated with this Queue (“SynchronizationScopeNone”).
You can also see that the Queue is empty (“Number of waiting requests” is zero) and there are no Requests in progress (“Number of driver owned requests” is zero). This Queue handles Read, Write, and Device Control functions via the Event Processing Callbacks shown. Note that there’s no Event Processing Callback provided for Internal Device Controls, so this driver does not handle that type of I/O operation. With the names of the I/O Event Processing Callbacks, you can easily cut and paste to set breakpoints on any of these routines if you desire.
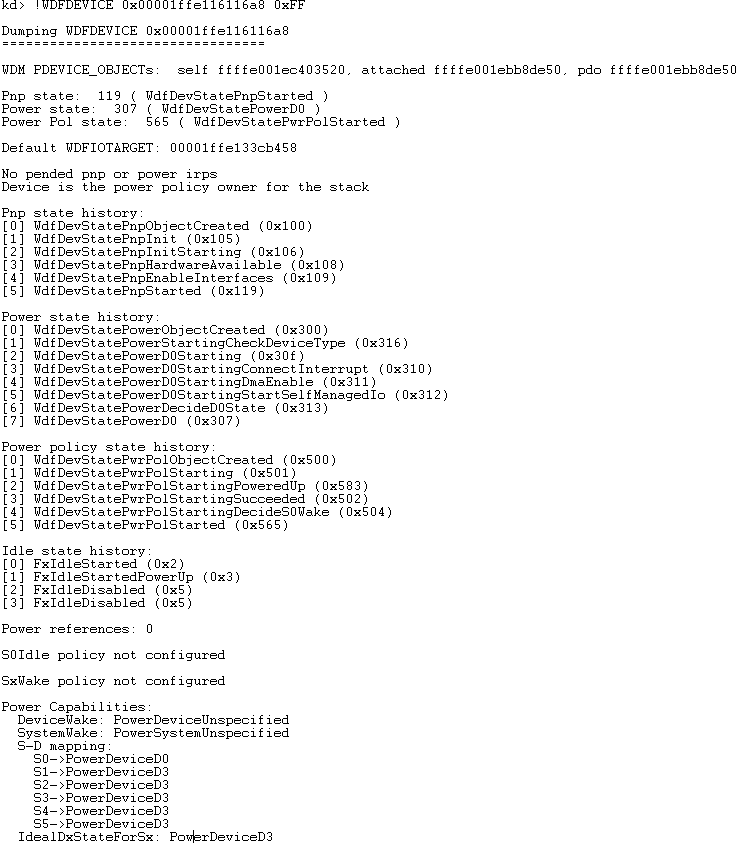
There’s also a huge amount of information you get about your device, its capabilities, and its state using the !WDFDEVICE command shown in Figure 3. Just by cutting and pasting that command (and adding the flags 0xFF, which means “give me everything!”) you get the large collection of information shown in Figure 5.

The output in Figure 5 is pretty much self-explanatory. Note that this can help you diagnose both PnP and Power issues. You also have the WDM Device Object pointers that correspond to the WDFDEVICE, its upper filter, and its PDO. So, you quite easily can take your debugging into the realm of WDM if necessary.
These commands are only examples. There are commands that are equally powerful for just about every WDF Object. And what’s really cool is that you can use just about all of these commands in UMDF V2, just like you can in KMDF.
There You Have It
So there are our top five hints for making your life developing and debugging WDF drivers easier. We’d like to hear your hints. If you’ve got a hint to share, tweet it to us @OSRDrivers . We’ll find a prize lying around the office for the best hint that’s tweeted to us in the two weeks following the release of this issue of The NT Insider. C’mon… let’s hear your hints!
